Weather
The  Weather feature in RigFlow is designed to integrate real-time weather forecasts into operational planning, ensuring enhanced safety and efficiency on the rig. It provides a centralized view of weather conditions, reducing the need to check multiple sources manually. This feature is particularly useful for planning offshore operations, where weather conditions significantly impact logistics and safety.
How it looks
The Weather panel in RigFlow consists of three main components:
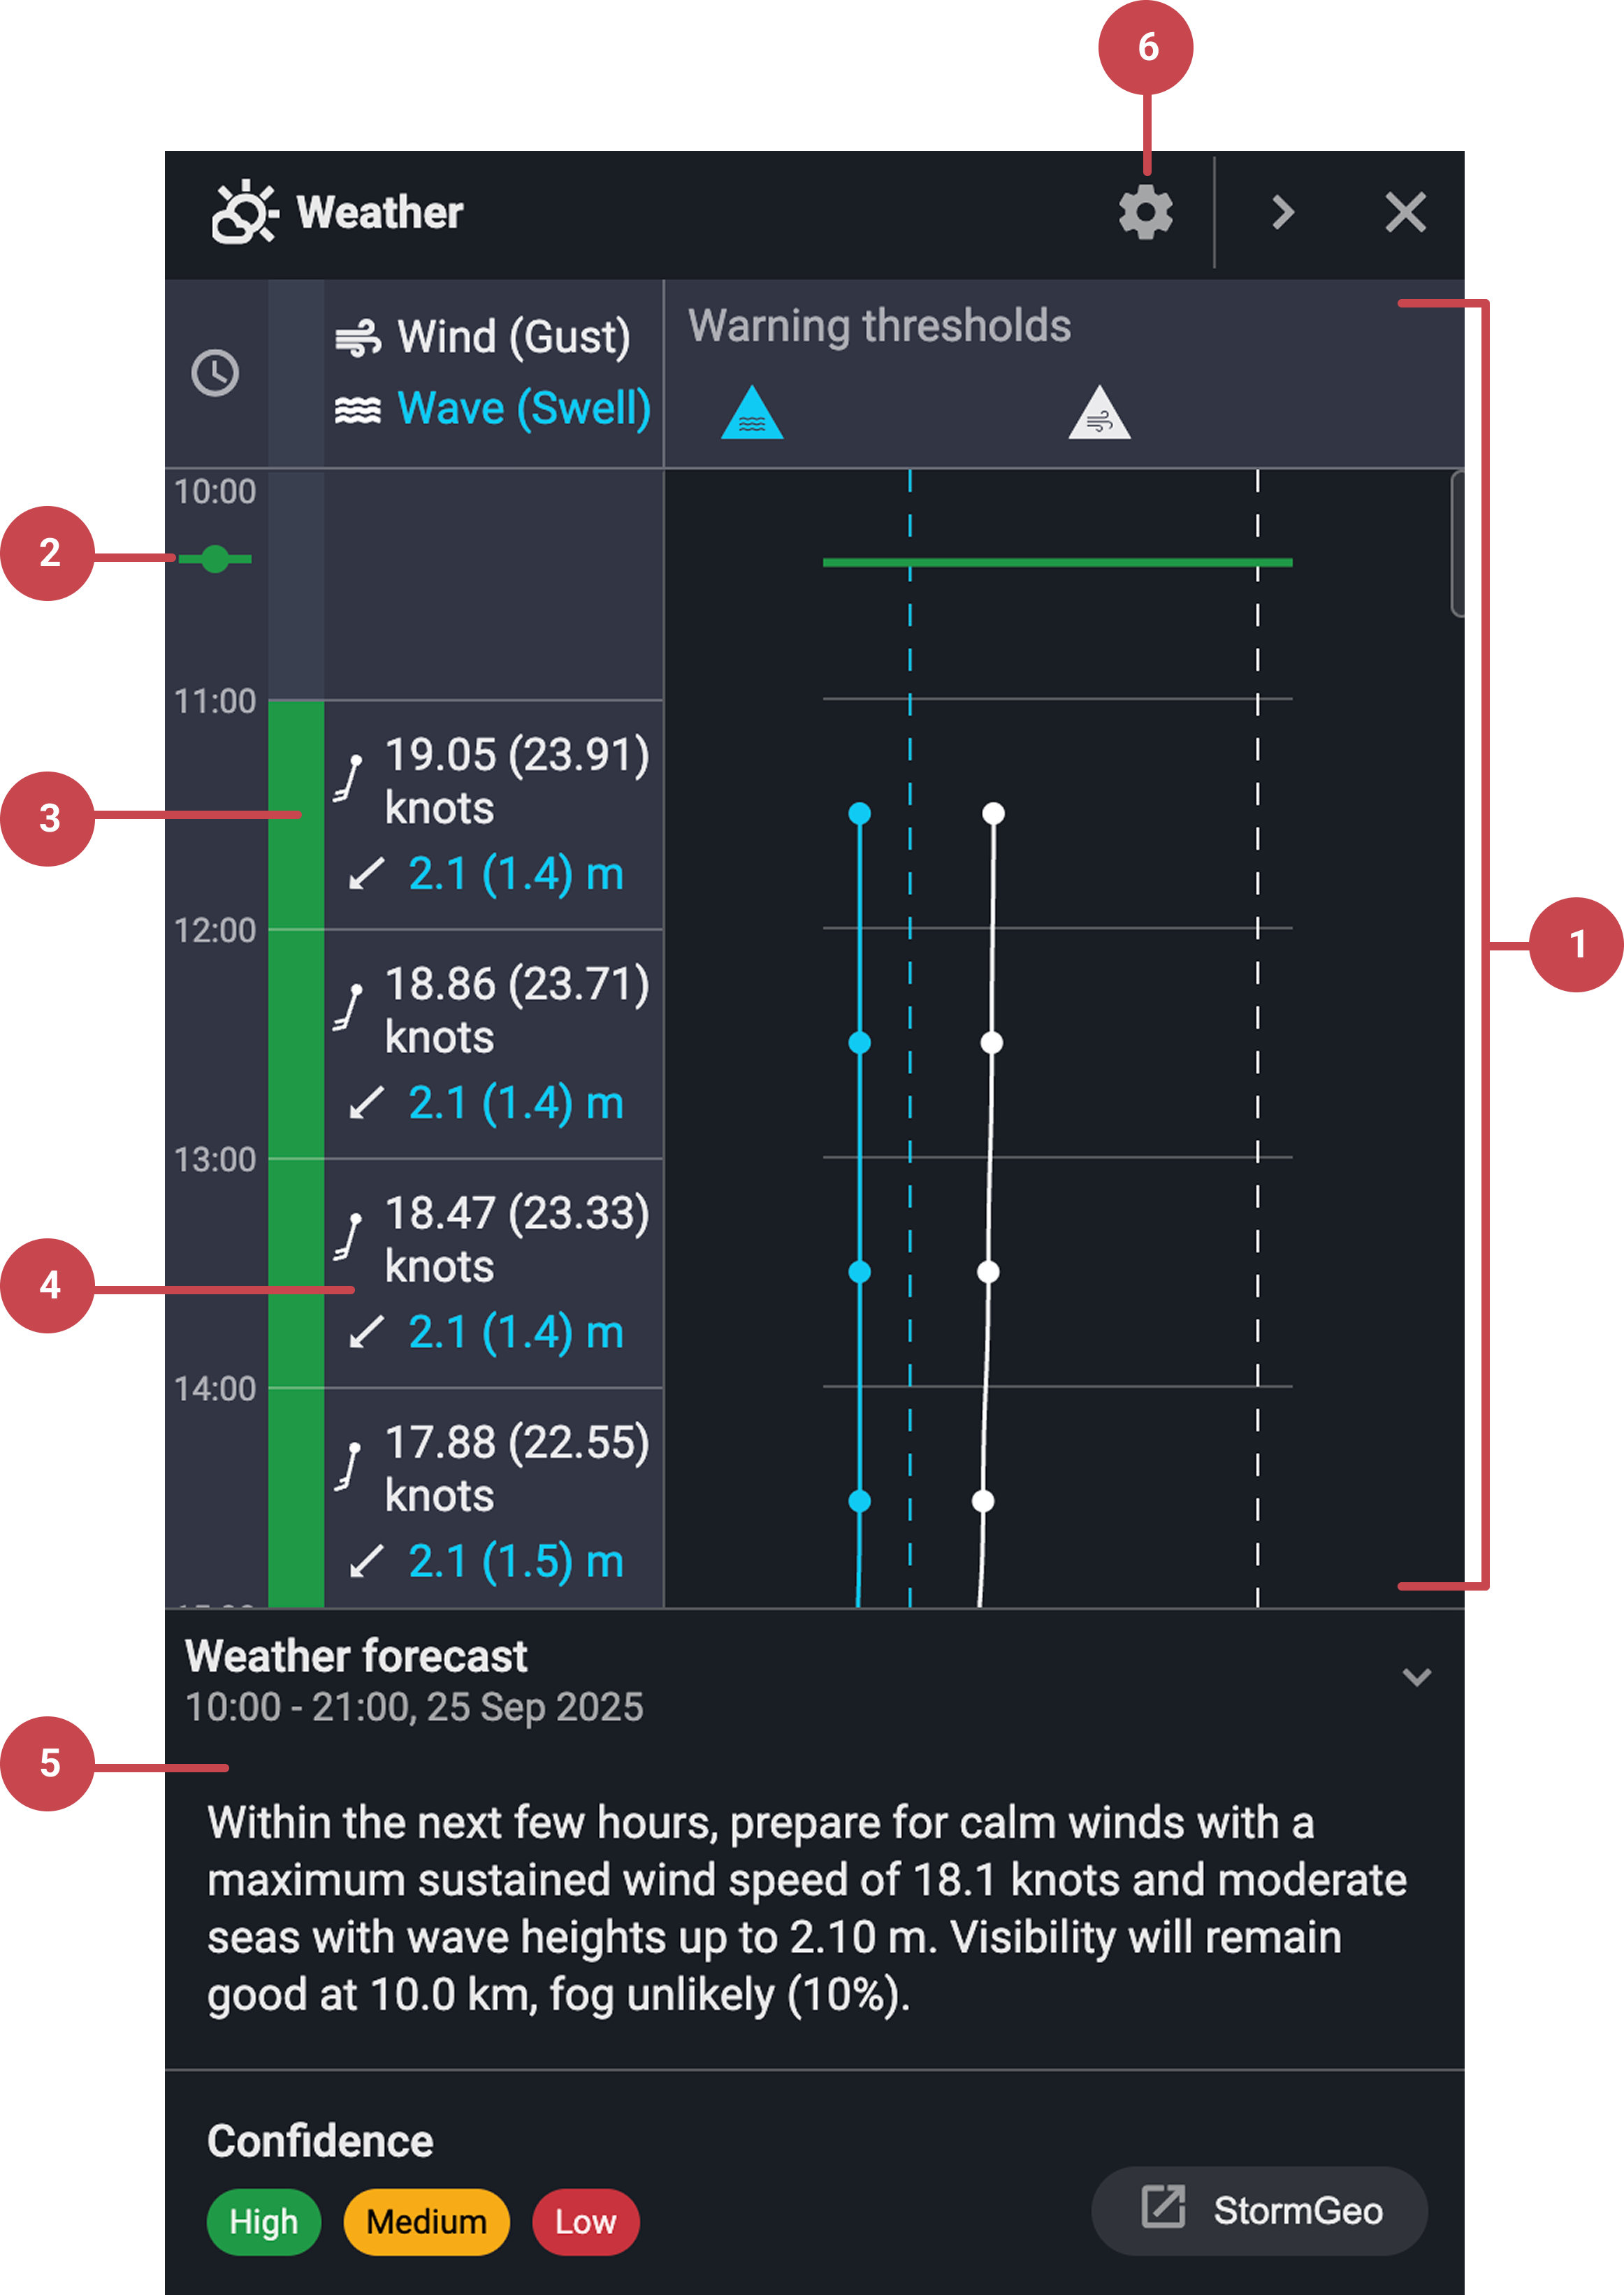
Weather Graph: Shows weather trends over time, along with visual warning thresholds to highlight potentially hazardous conditions.
Important
The Weather app displays forecasted weather data only. Historical weather data is not available in this feature.
Now line: A green line that highlights the current time, making it easy to align forecast data with real-time operations.
Confidence Level: Visual color codes indicate how reliable the forecasted weather data is. A section at the bottom of the panel explains the meaning of each color and includes a link to the weather service provider’s main website for more detailed information.
Weather table: Displays key forecast data, including wind speed, swell height, swell direction, and a wind barb indicating the wind’s direction.
Weather Forecast: Provides a weather summary for quick reference.
Settings: Opens the configuration panel where you can adjust the windspeed unit metrics and the warning thresholds for wind and wave conditions based on your operational needs.
These elements are designed to enhance situational awareness, allowing for better decision-making based on reliable weather forecasts.
Step-by-step instructions
Navigate to the Weather app
Locate the Weather app: Navigate to the Right sidebar in RigFlow.
Open the Weather app: Click the
 Weather app icon. It will open a panel divided into a graph and a data table.
Understand the Weather panel
Understand the Weather graph: The graph includes two main visual elements, each represented by a distinct color, wave swell, and wind speed (gust). With data presented based on the available forecast:
0-66 hours: Hourly data points.
67-120 hours: 3-hour intervals.
121-168 hours: 6-hour intervals.
Note
If no weather data is available, the visualization remains empty.
Locate the time indicators: The green NOW line shows the current time on the weather graph, while a white line marks the transition between today and tomorrow. Together, these indicators help you easily navigate the forecast timeline.
Interpret the warning threshold: If
 wind or
  wave data crosses this threshold, the corresponding part of the graph turns into a different color, indicating potentially hazardous conditions. You can hover over the icon to see the threshold values.
Use the weather table: Each cell represents one hour and displays essential forecast details, including the confidence level, a wind barb indicating wind direction, and the swell direction.
Adjust weather settings
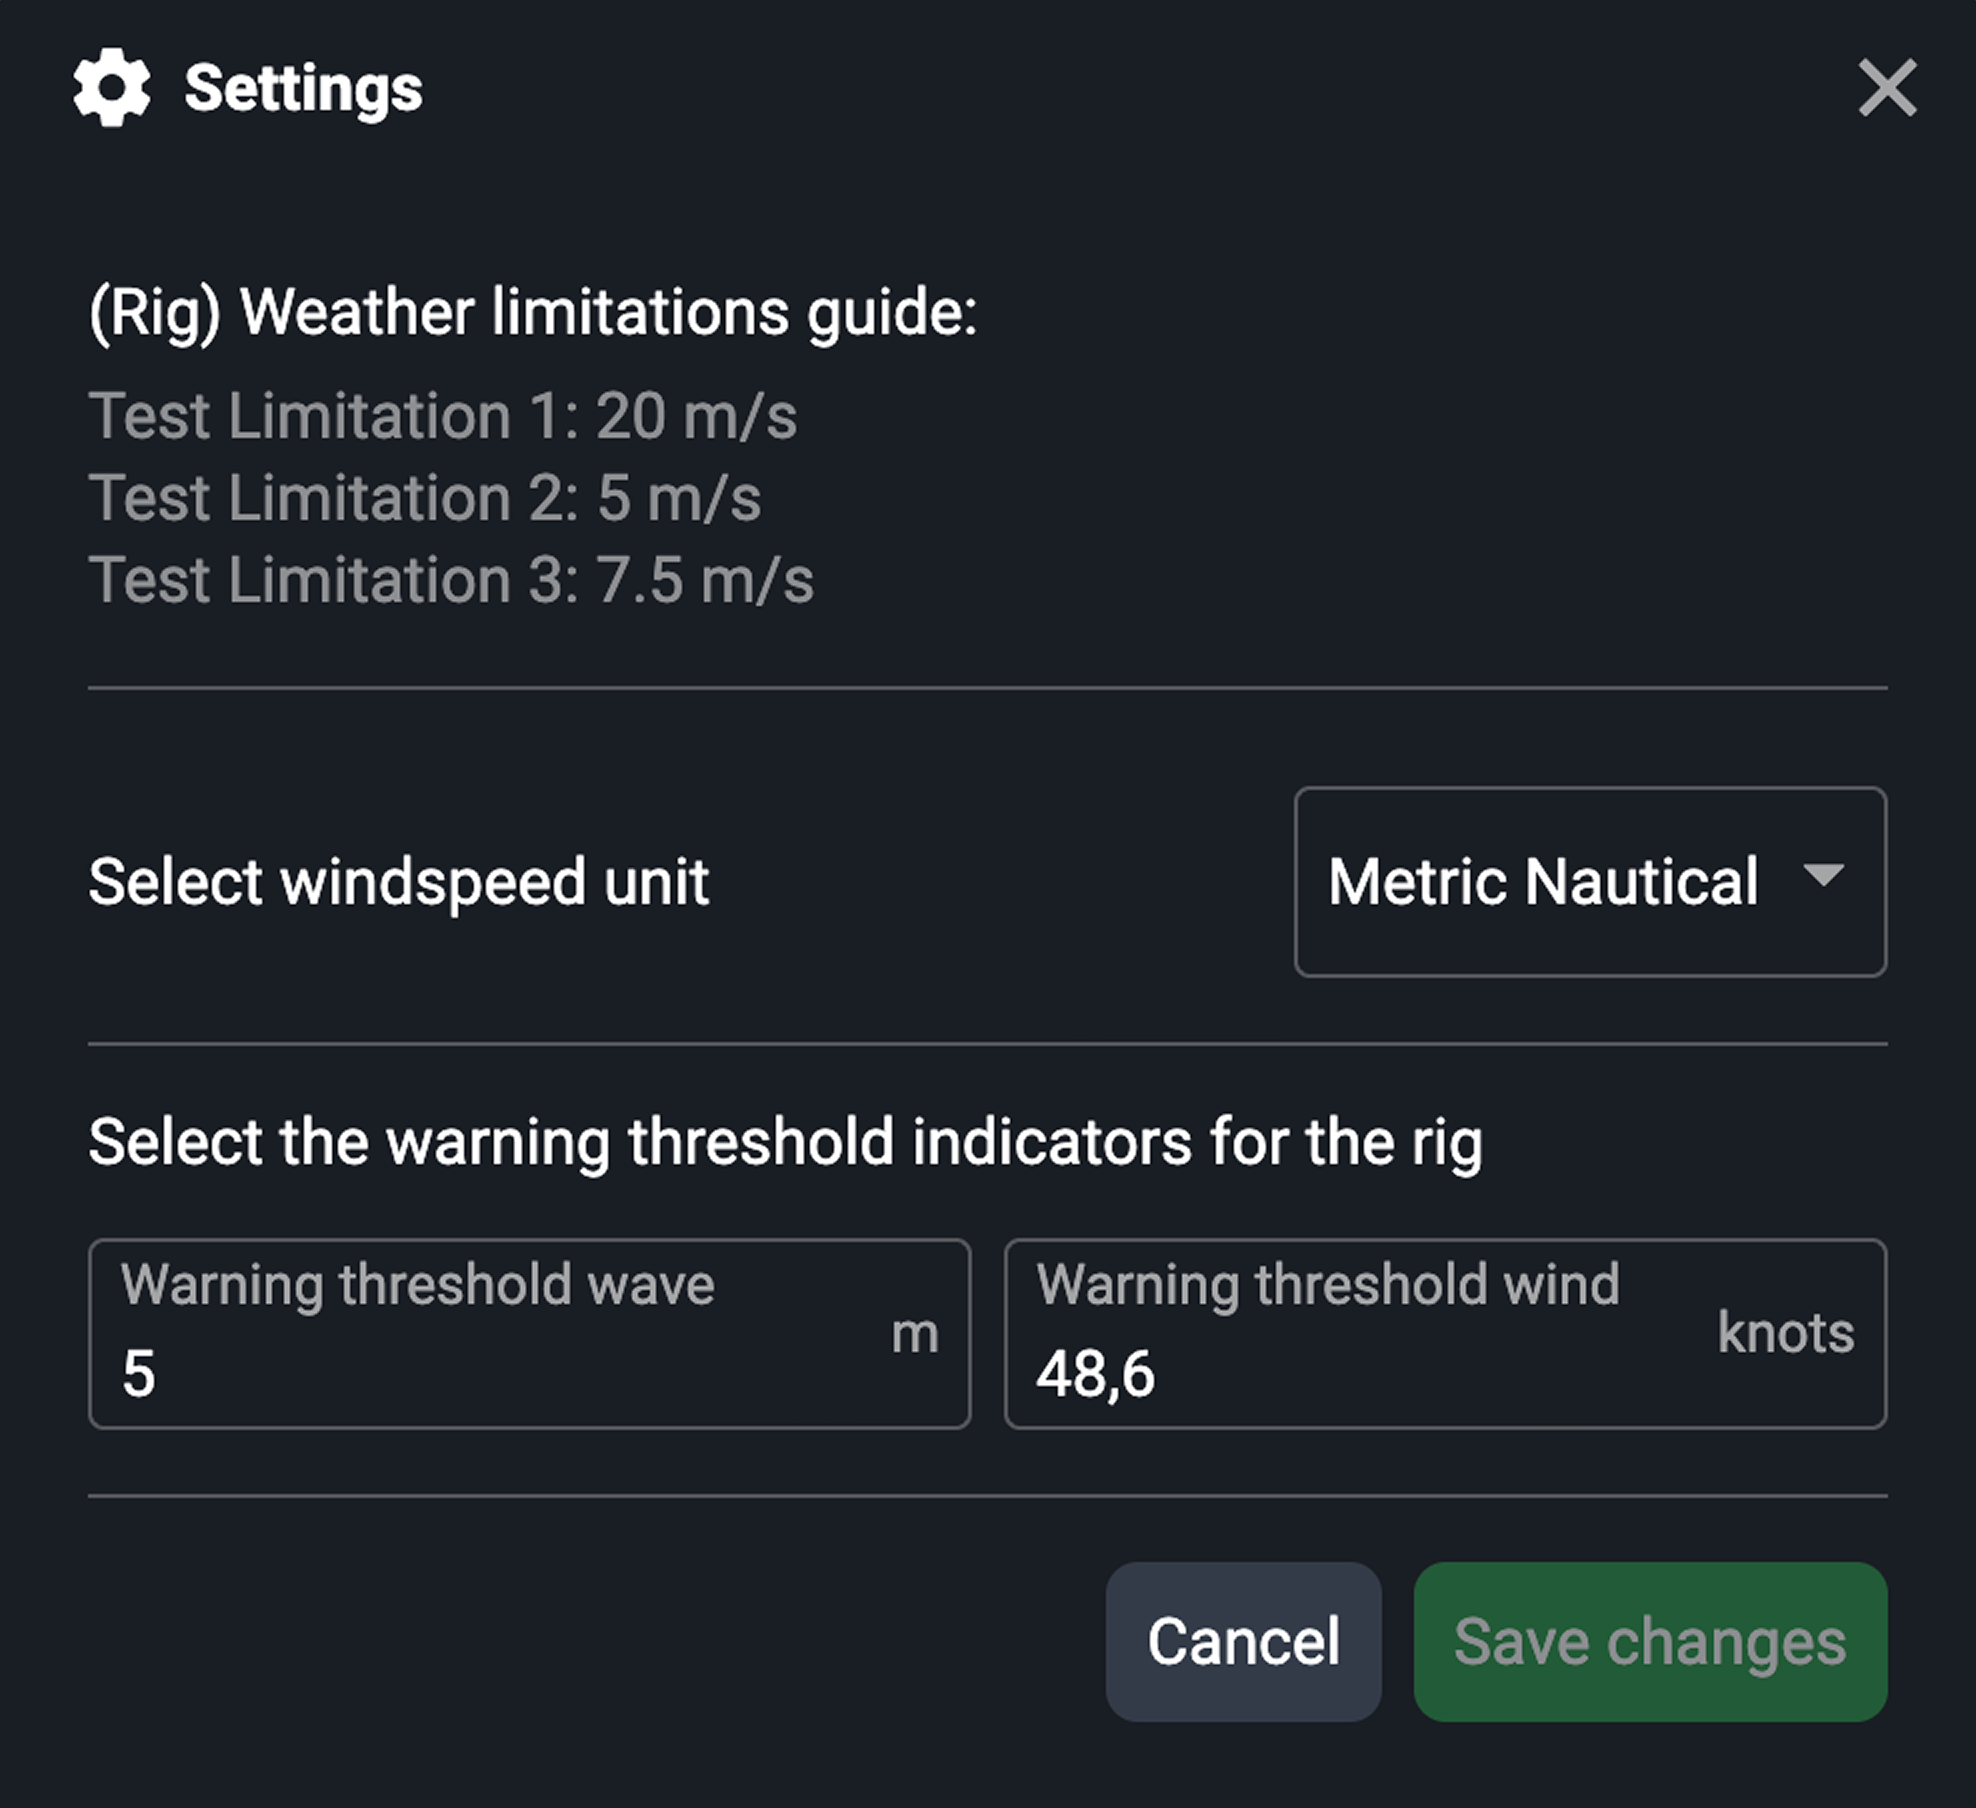
Access the settings: On the Weather panel, click on the
 Settings icon to access settings.
Adjust your rig's Weather limitation guide: Each rig can have its own predefined weather limitations configured by H56 support. If you need to update these thresholds, please contact H56 support.
Select the windspeed unit: Click the dropdown and select between Metric nautical or Metric.
Set warning thresholds: Customize wind and wave thresholds to match your rig’s operational limits. These settings are saved in your browser’s local storage and will only apply to your current device.
Save Changes: After adjusting your settings, click Save Changes to store them locally in your browser.
Integrations to external services
Currently, our only integration for displaying weather and forecasts in RigFlow is with StormGeo.
Examples
If a scheduled offshore lifting operation is planned, users can check the wind and wave conditions in RigFlow to determine whether conditions are within operational limits.
Users can set custom warning thresholds for wind speed, ensuring proactive safety measures are taken when adverse conditions are expected.
Tips and tricks
You can change the number of decimals displayed on the Weather app by using the global settings for decimals.
The panel includes forecast information only; therefore, older portions of the graph will appear blank.
The Weather widget on Rig Page mirrors the Weather app, and both can be opened at the same time for convenience.