Realtime data
The  Realtime data feature allows users to monitor live operational data directly from the rig. This tool plays a critical role in enhancing safety, efficiency, and decision-making during drilling operations by offering up-to-the-minute visibility into the rig’s performance.
How it looks
Realtime data in RigFlow provides a powerful, structured interface for live monitoring of rig operations. It consists of a dashboard layout with individual Realtime data cards. Each area is designed to give operators maximum clarity and flexibility when tracking real-time rig data.
Dashboard

The Realtime data dashboard serves as the main workspace for monitoring sensor data. It contains several configurable tools and sections:
Realtime data cards area: This is the area where selected sensor data cards appear. Each card displays live data and performance trends.
Operational modes: These are predefined sensor groupings aligned with typical rig operations. The standard areas include drilling, circulate, tripping, and custom. These groupings streamline setup and ensure relevant data is grouped by activity.
 Edit tags: The tab displays all the most critical sensors available in RigFlow. Click the checkbox next to its title to add or remove a sensor from the Realtime data dashboard. This makes it easy to customize what you monitor based on your immediate role or task.
 Edit view: This tool allows users to adjust how information is presented across all Realtime data cards. You can toggle trendlines on/off for a simplified or detailed visual, and expand cards horizontally to maximize data visibility when needed.
 Collapse and
  expand icon: A control icon lets you collapse or expand sections of the dashboard to better fit your screen or focus only on certain data cards.
Realtime data cards
Each Realtime data card provides a compact yet detailed view of individual sensor metrics. The layout includes:
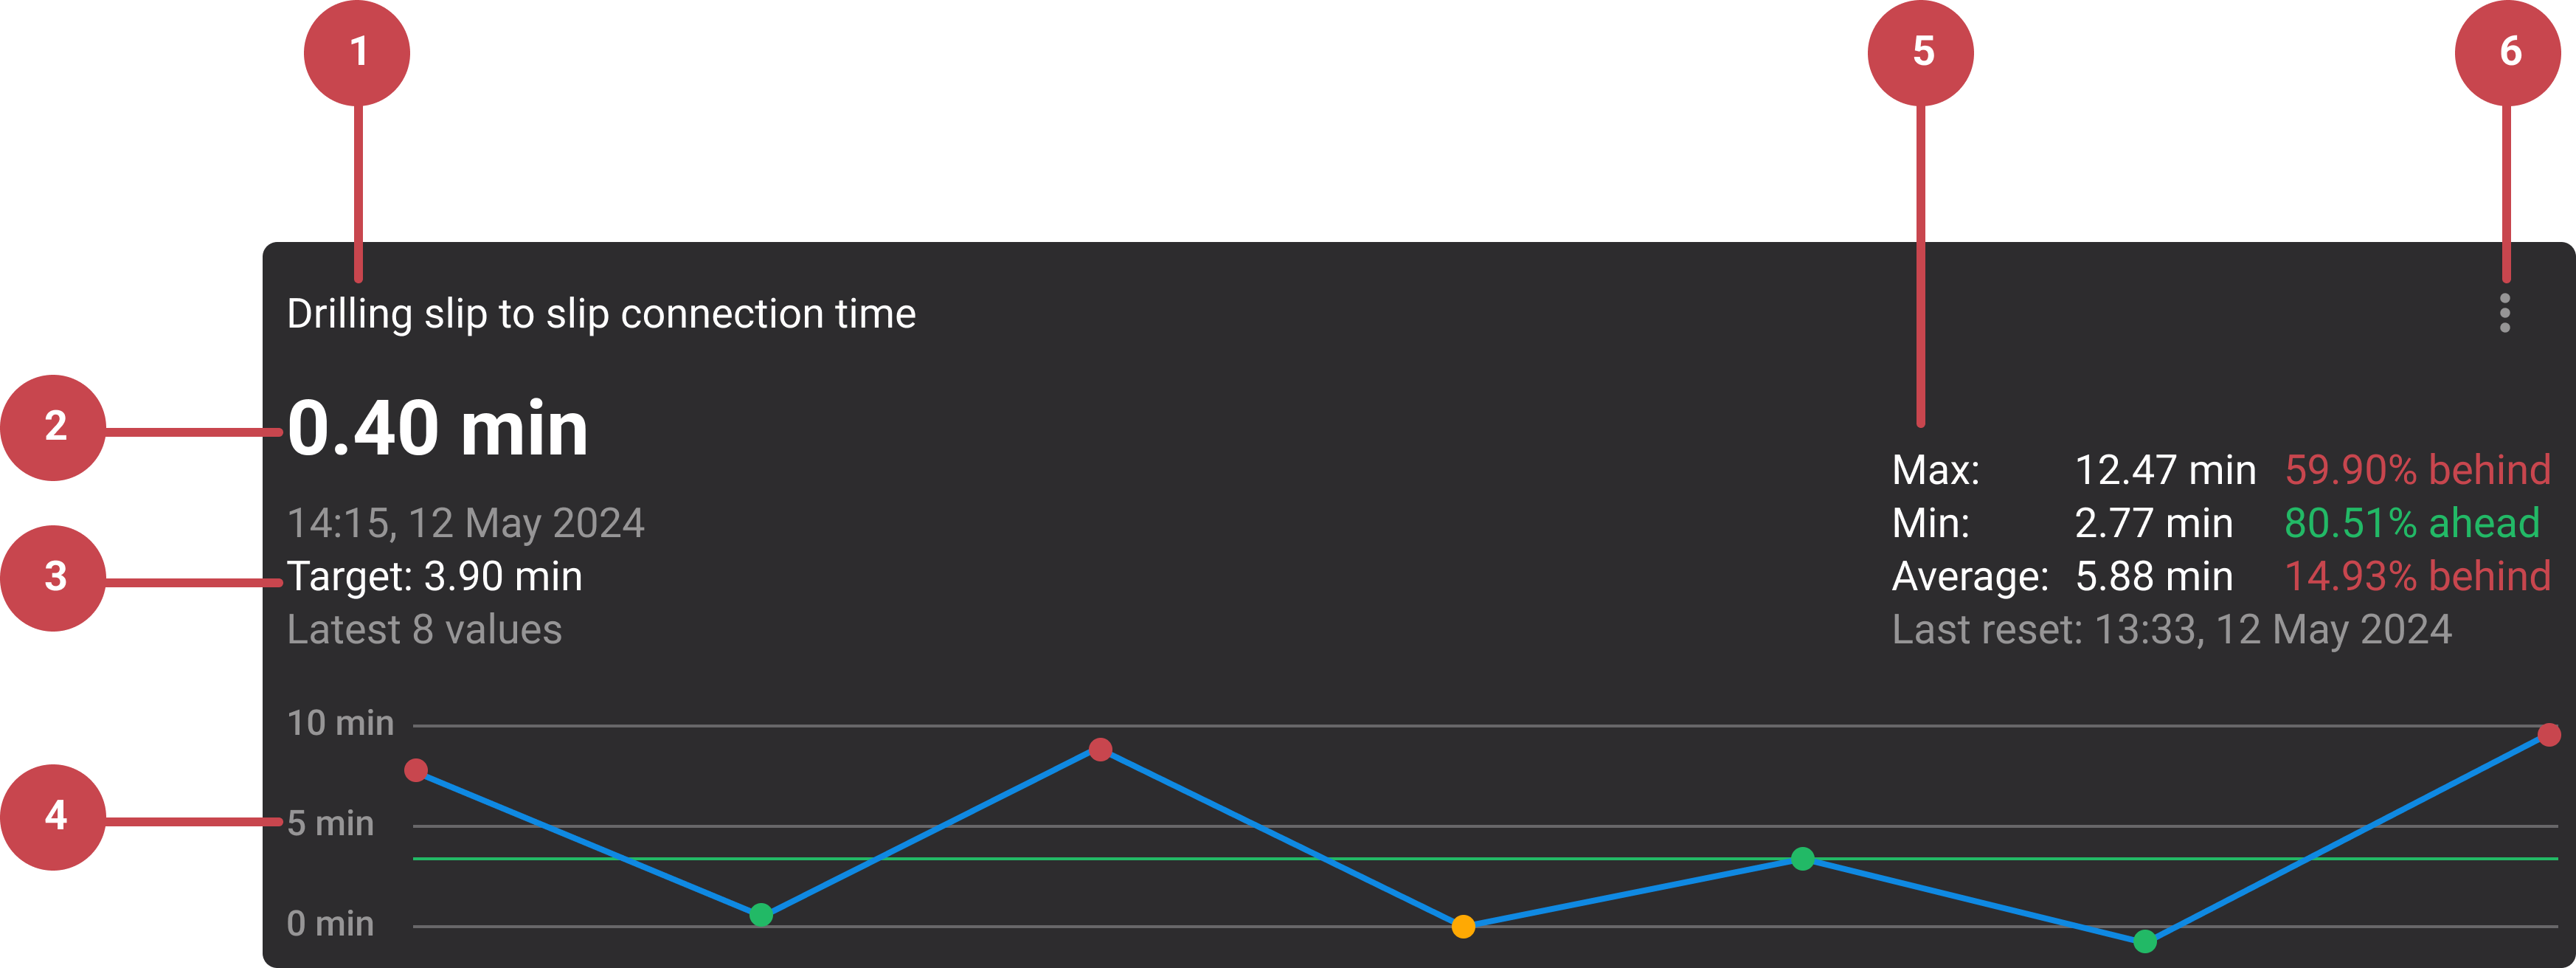
Card header: Displays the name of the sensor.
Live sensor value and timestamp: Shows the current sensor value along with the time of the last update, helping you validate that the feed is active and fresh.
Performance metrics: The card includes target value and the latest set of values.
Trend line: A graphical line shows recent data history (last 15 minutes), enabling quick detection of trends or anomalies.
KPI details (Expanded View Only): When a card is expanded users can see a detailed KPI setup, including max, min, and target thresholds. Color coding indicates whether the current reading is within acceptable ranges.
 Options menu: Clicking the more icon opens additional settings allowing the user to show or hide the trendline, expand or collapse the card view, and edit KPI thresholds and recalculate performance.
Step-by-step instructions
Navigating the Realtime data dashboard
Open the Realtime data feature: Go to the Right sidebar and click the Realtime data icon. The Realtime data dashboard will open, showing your sensors grouped under operational tabs for quick access.
Select an operational mode: Open the Operational Mode dropdown and choose the mode that matches your current activity (Drilling, Circulate, Tripping, or Custom). Once selected, the Realtime data feature will automatically load and display the set of sensors relevant to that specific operational mode.
Note
Use Custom mode to focus only on specific sensors.
Add and remove sensors: Open the
Edit tags tool on the dashboard and browse through the list of available sensors under each operational mode. Check the box next to any sensor you want to display, and uncheck those you don’t need. Your dashboard will instantly update.Customize your view: Click on the
Edit view icon and toggle between the options:Show trend on all - to display trendlines on all Realtime data cards.
Expand all - to expand all the displayed cards to fill the horizontal space.
This process can also be done on each card by clicking on the
menu icon and toggling the options.
KPI setup
You can define target values and performance limits by setting up your KPIs.
Open the options menu: On the Realtime data dashboard, find the KPI card you want to configure. Click the
more menu on that card to access its settings and define how its calculations are handled.Set KPI values: In the options panel, type your desired Max, Min, and Target values into their respective fields. These values define the performance range and benchmarks for that sensor.
Adjust the view: Decide how you want the card displayed on the Realtime data panel:
Toggle Show Trend to display or hide the trendline.
Toggle Expanded View if you want the card to use more space for easier reading.
Reset KPI calculations: After updating your KPI settings, reset the KPI calculation to apply the changes. You can choose to:
Start from now to begin calculations immediately.
 Select start time and define a specific point in time to recalculate from.
Custom mode or empty panel
If your Realtime data panel is blank or you’ve switched to Custom mode, you can configure it by adding and managing sensors to suit your needs.
Add sesors: Click the
Edit tags button. From the list of available sensors, check the boxes next to the sensors you want to display. They will appear on your panel immediately.Adjust your view: For each card on your panel, click the
More menu to customize its display. You can:Toggle Show Trend to display or hide the trendline.
Toggle Expand View to give the card more space.
Reset the panel: If you want to start fresh, click Reset to default on the
Edit tags button to clear all previously selected sensors and return to an empty view.
Examples
A drilling engineer monitoring pressure, torque, and ROP can use the Drilling tab and visualize trendlines and KPI performance.
During tripping operations, sensors relevant to pipe movement and hole cleaning can be highlighted in the corresponding tab.
Tips and tricks
Pre-defined sensor groups: Use these for faster setup. The Custom tab is great for user-specific needs.
Trendline analysis: Helpful for identifying early signs of issues (e.g., pump pressure spikes).
Range visibility: Hover over the cards' trendlines to view color indicators and target values. This lets you quickly confirm whether the sensor is staying within the defined safe and optimal ranges.
Performance optimization: Review the last 15-minute trends to adjust parameters in Realtime data.
Remote oversight: Realtime data access helps off-site personnel stay in sync with rig operations.
Troubleshooting
Inaccurate readings: If you're experiencing wrong readings from the sensors in RigFlow, get in touch with our support team.