Real-time
Real-Time Data in Rig Flow allows you to monitor live operational data from the rig, wherever you are. This feature helps you stay informed about drilling activities and make quick decisions.
Overview
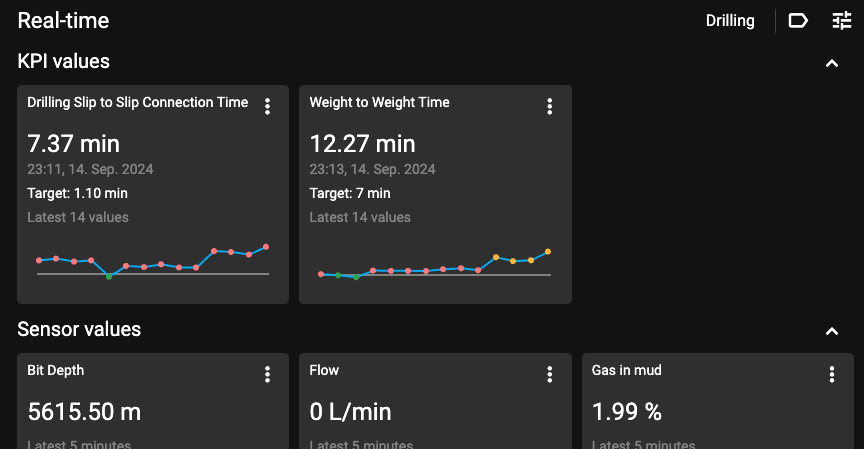
The Real-Time displays a dashboard with live data streams coming directly from the rig, showcasing various operational parameters. The layout includes a list of available parameters that users can expand to view more detailed data, including graphical representations for the last 15 minutes of operations.
Real-time toolbar
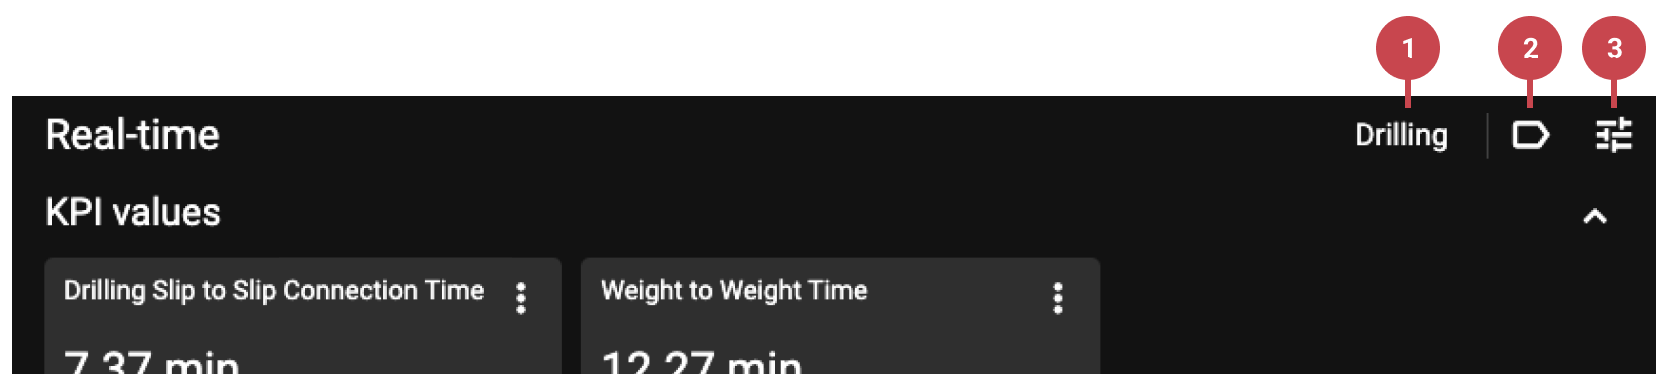
Pre-defined Settings: These are areas with pre-assigned sensors. The standard areas include Drilling, Circulate, Tripping, Intervention, and Custom. The Custom area is blank, allowing you to choose your own sensors.
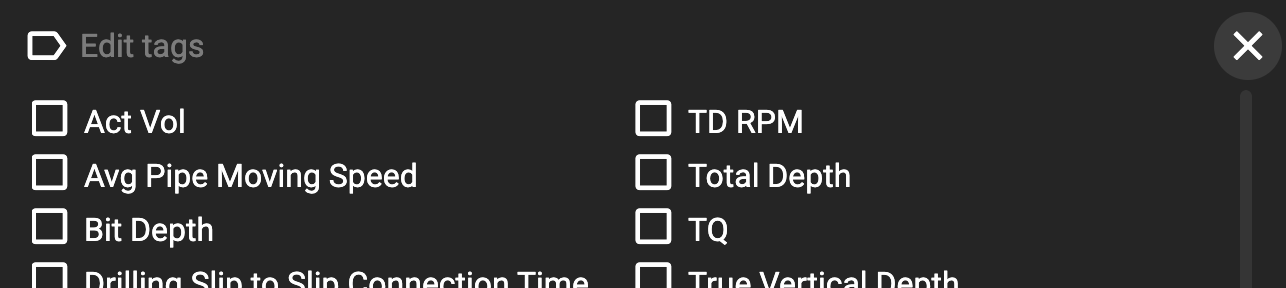
Tabs with sensors: The tab dialogue displays all the most critical sensors available in RigFlow. Click the checkbox next to its title to add or remove a sensor from the real-time dashboard.
Edit View: Toggle options to display trendlines on all Real-time cards or to expand the cards to fill the horizontal space.
Real-time card
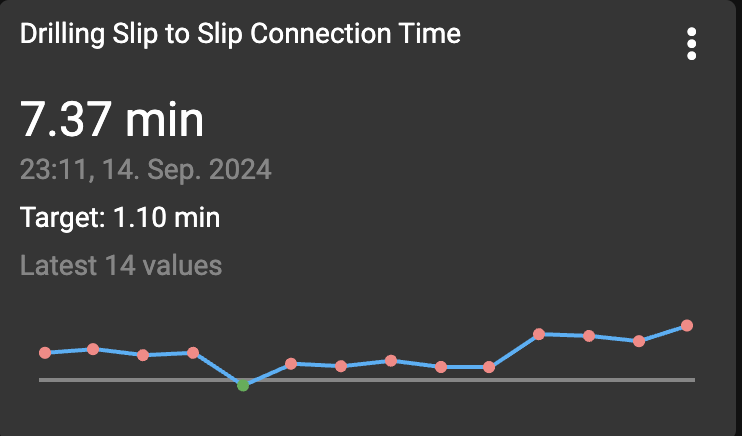
Each card is constructed using simple elements: a header, current sensor information, the date of the last update, and, if applicable for KPIs (Key Performance Indicators), the target value and the latest set of values. A trend line is also included, and for KPIs, it indicates whether performance is above or below the specified target.
Options on card
To access the "Show Trend", "Expand View", and KPI setup options on a specific card, click on the  More icon.
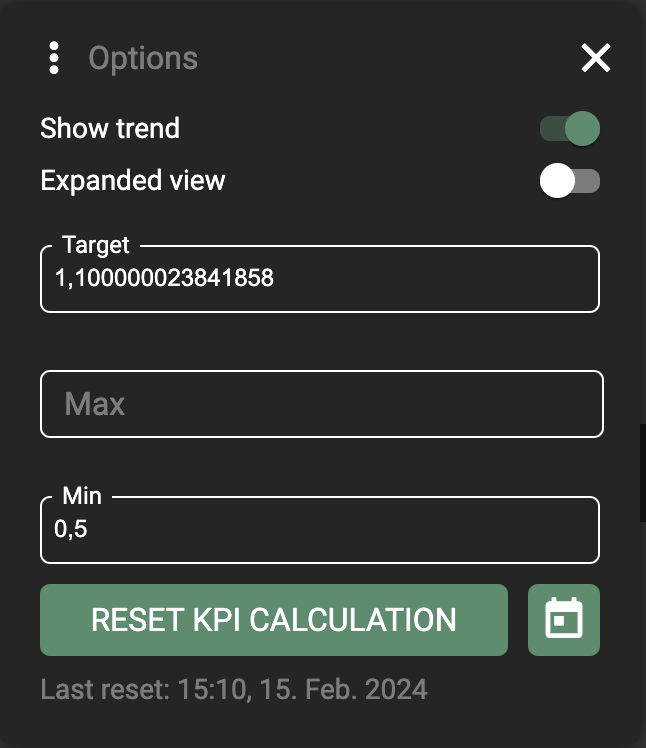
The KPI setup will include a Target and configurable Max. and Min. values. When changed, you need to reset the KPI calculation.